
Table of Contents
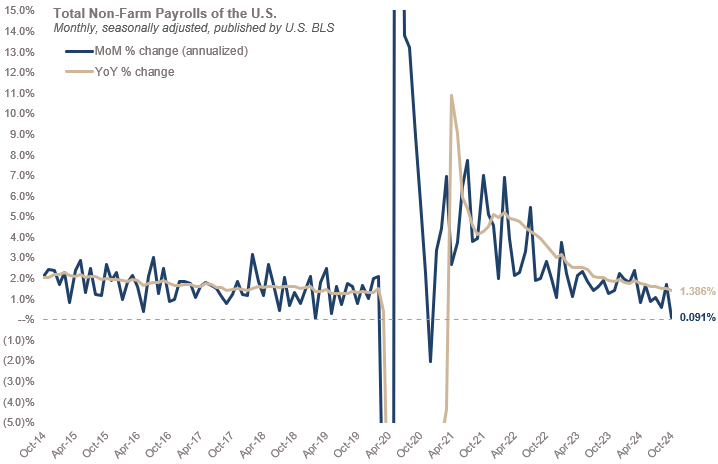
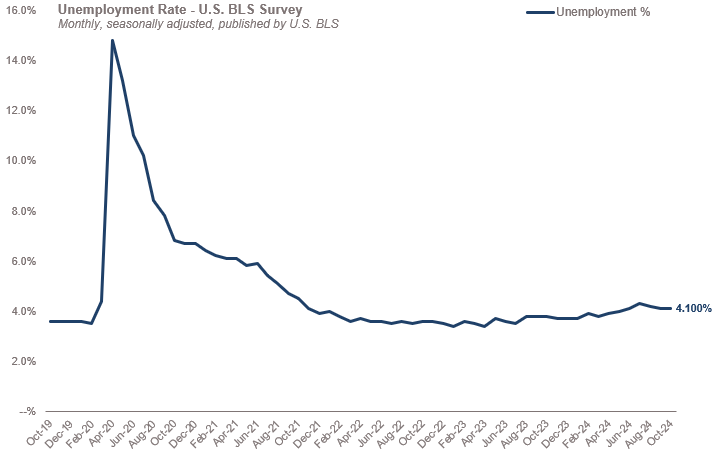
Y241117 / Non-Farm Payrolls registered +0.008% for October 2024 / +0.091% annualized MoM increase / BLS Unemployment Survey registered 4.100% for October 2024
Below are the three measures of unemployment we follow at Yield to Best. Total Non-Farm Payrolls (monthly), Unemployment Survey (monthly), and Continued & Initial Unemployment Claims (weekly).
The data was pulled on 17 November 2024 and is subject to revision by the U.S. Bureau of Labor Statistics (BLS) and the U.S. Employment and Training Administration.
Scroll past the chart for amplifying information on data source and interpreting the output.
1 Total Non-Farm Payrolls – October 2024
Percent change MoM annualized (blue) and YoY percent change (gold)
2 Unemployment Rate (U.S. Bureau of Labor Statistics Survey) – October 2024
Number of people unemployed as % of the labor force (blue)
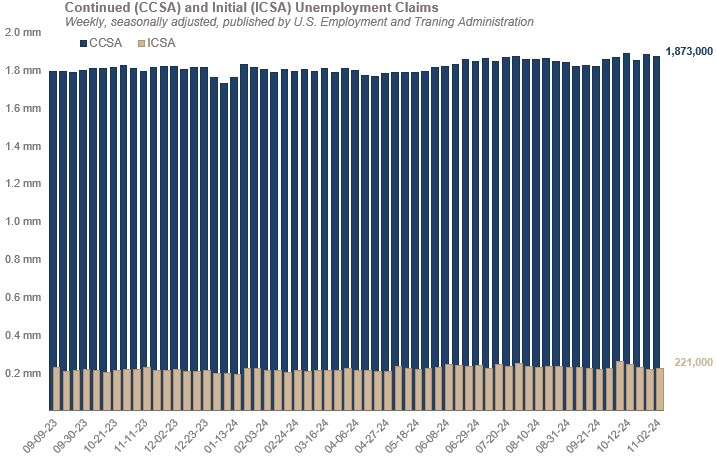
3 Continued and Initial Unemployment Claims – November 2024 (weekly measure)
Number of people who have already filed an unemployment claim, with unemployment ongoing (blue) and number of initial claims filed by recently unemployed individuals (gold)
4 Data Sources
Total Non-Farm Payroll (monthly, from the U.S. Bureau of Labor Statistics – BLS) is a measure of the number of U.S. workers in the economy (excl. proprietors, private household employees, unpaid volunteers, farm employees, and unincorporated self-employed). The measure accounts for ~80% percent of the workers who contribute to Gross Domestic Product (GDP). The MoM or YoY changes shown above, represent the percent change from the level of the number of workers compared to the reference period (last month for MoM or last year for YoY).
All Employees, Total Non-Farm (PAYEMS) is available here.
The Unemployment Rate (monthly, from U.S. BLS) represents the number of unemployed as a percentage of the labor force. The data is a result of a survey, or statistical sample, of the population. For the survey, the labor force includes people aged 16 and above, and currently reside in one of the 50 U.S. states (or D.C.).
Unemployment Rate (UNRATE) is available here.
Continued and Initial claims (weekly, from the U.S. Employment and Training Administration) refer to the actual number of people who have already filed a claim and are unemployed (Continued Claims, also referred to as insured unemployment) and the number of people who have filed new claims after separation from an employer (Initial Claims). Said differently, Continued Claims are those currently unemployed (ongoing claims) and the Initial Claims are for those requesting a determination of eligibility for the unemployment insurance program in the U.S. (incoming claims).
Continued Claims (Insured Unemployment) (CCSA) is available here and Initial Claims (ICSA) are available here.
All data shown above is seasonally adjusted and remains subject to revision by the appropriate U.S. government department. Both the U.S. Bureau of Labor Statistics and the U.S. Employment and Training Administration are part of the U.S. Department of Labor.
5 Interpreting results
These three data sets can provide useful insights into the underlying economic situation in the U.S. because they represent observations on the labor market and can illustrate the number of jobs added or lost in the economy. Increases in employment generally indicate that businesses have created jobs, which may suggest general business activity has accelerated. Inversely, a reduction in jobs generally indicates that businesses may have lost jobs, which may suggest business activity has slowed down.
They are all considered lagging indicators of the business cycle as they are backward looking and the labor force generally expands and contracts in response to the economic environment.
COMMENT: Unemployment data is not precise and subject to revision. In an economy as large and dynamic as the U.S., the challenge of accurately measuring such a fluid number is considerable. We believe, with the three measurements illustrated above, the U.S. DoL provides as a fairly representative illustration of underlying unemployment. For interested readers, there are numerous alternate sources of public information (payroll growth, hours worked, overtime hours, temporary worker utilization, etc.) that you are encouraged to investigate.
6 Why this output can be helpful
In terms of the U.S. Federal Reserve and monetary policy:
The U.S. Federal Reserve has a dual mandate to support maximum employment and stable prices. These two objectives were established by Congress and form the core of the Fed’s monetary policy. Maximum employment broadly aims to create conditions where everyone who wants a job can find one and price stability broadly aims to maintain low and stable inflation over the long run.
Historically, if the rate of unemployment changes materially in the U.S. the Fed generally responds with policy changes.
In terms of the general business cycle:
Unemployment is at its highest somewhat after an recovery has started and is at its lowest somewhat after a peak in economic expansion. An overheated economy often leads to inflation when unemployment is very low.
COMMENT: The future of the U.S. labor market and any inflation or disinflation, we may or may not experience, in our view, will likely have highly material impacts on the cost of debt for all borrowers (governments, corporations, consumers, etc.). We see inflation as the most important factor for the cost of borrowing, excluding issuer specific risks, and believe expected future returns on all investment will be negatively impacted should inflation materially rise. We view unemployment as an essential component to measuring economic conditions and assessing broader inflationary risks.
