
Table of Contents
Y240514 / Aggregate dividend data as of Q1 2024 /
Below is the quarterly output for dividend data, which also includes repurchases for reference. This output helps us keep a passive watch on the largest dividend payers.
We list the top 25 companies sorted by the total sum of nominal dividends for the last 5 year period and LTM period. This is one method we use to narrow our focus on areas for further investigation and potential investment.
The data is aggregated from public filings of a universe of ~3,200 publicly listed companies. All companies in the index are U.S. companies or are listed on a U.S. exchange.
Scroll past the tables for amplifying information on interpreting the output.
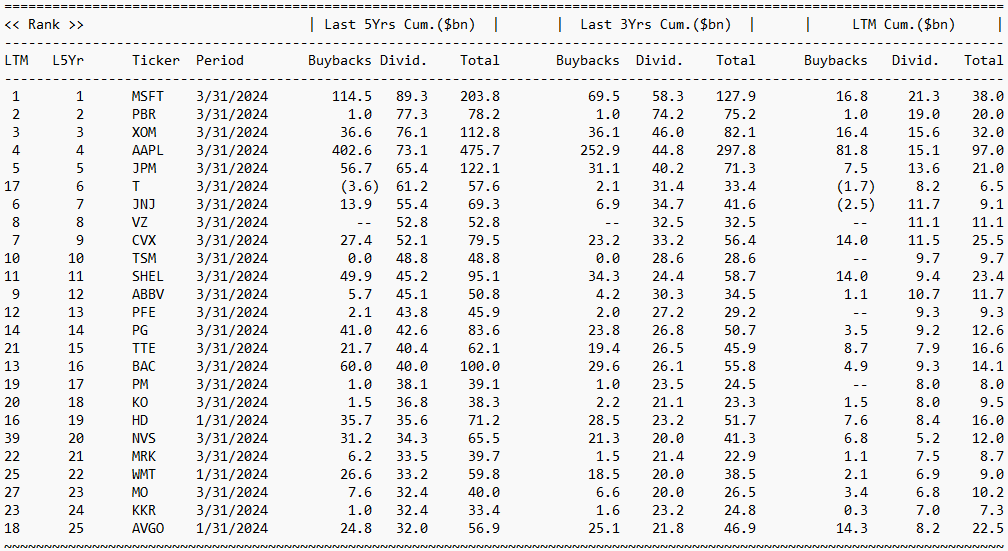
1 2024 Q1 – Largest Dividends Paid for Last 5 Years
Sum of total nominal dividends for the last 5 year period, sorted largest to smallest
2 2024 Q1 – Largest Dividends Paid for Last Twelve Months
Sum of total nominal dividends for the LTM period, sorted largest to smallest

3 Interpreting results
The universe of companies included in the index are most entities registered on a U.S. exchange with a market capitalization above a few hundred million USD.
The Rank column illustrates a company’s position, within the list of ~3,200 companies, when being sorted along a different index. LTM and L5Yr (last 5 year) periods are illustrated for comparison.
The Period column is the date of most recent filing by the company, and the most recent financial information included in the output.
A negative Buybacks value corresponds with the company issuing stock, on balance, for the period.
4 Why this output can be helpful
We find watching this output over time, allows us to quickly identify potential companies or situations to investigate further, augments the weekly Value Line publication well, and keeps us informed on aggregate data for dividends.
Purchase Dataset
Aggregate share repurchase and dividend data is available for a few dollars ($USD) here.
The specific dataset included above is available for sale here.
Yield to Best doesn’t rely on advertising and instead prefers to share our work with like-minded readers and analysts.
Known Discrepancies
This data is taken from public filings and is not completely reliable. We do not always recapture material restatements, and subsequently report on YTB, if a company files an amendment. We use this data as a starting point for further analysis and investigation.
Companies have various reporting periodicities and are subject to annual business cycles that this output does not capture. We are broadly following a calendar year for each quarter, when reporting the aggregate figures. Said differently, this output ignores the individual companies fiscal year and actual reporting cycle, however we do provide the Period column for reference.
The index, or universe of companies we are including, was first created in 2023 and is subject to the analytic judgement and biases of YTB. We do make a deliberate effort to include any company paying material dividends or repurchasing stock.
